WE ARE INNOVATIVE
- Home
- Products
- Application
- SmarTune™
- Resources
Grow3
CONTROL THE GROWTH
Nothing feels better than getting the results you were after.

- About Us
- Contact Us
Grow3
Nothing feels better than getting the results you were after.


For decades the lighting industry has relied on the CIE 1931 and 1976 Chromaticity Diagram to define what the exact color spectrum output of a light fixture produces. While this has served the general illumination industry well and will continue to serve them well, this color diagram is difficult to explain the definition of the color of a horticulture light fixture.
All horticulture lights have various spectrum wavelengths to achieve ideal photobiological response and photosynthesis.
Traditionally, grow lights have used spectrum graph reports to provide a visual depiction of the light spectrum that the fixture produces. While this works well for general light fixtures that cannot adjust the spectrum, this is difficult to apply to the GROW3 products. See example Figure 1. GROW3 SL Fixture Ratio Spectrum Graph.
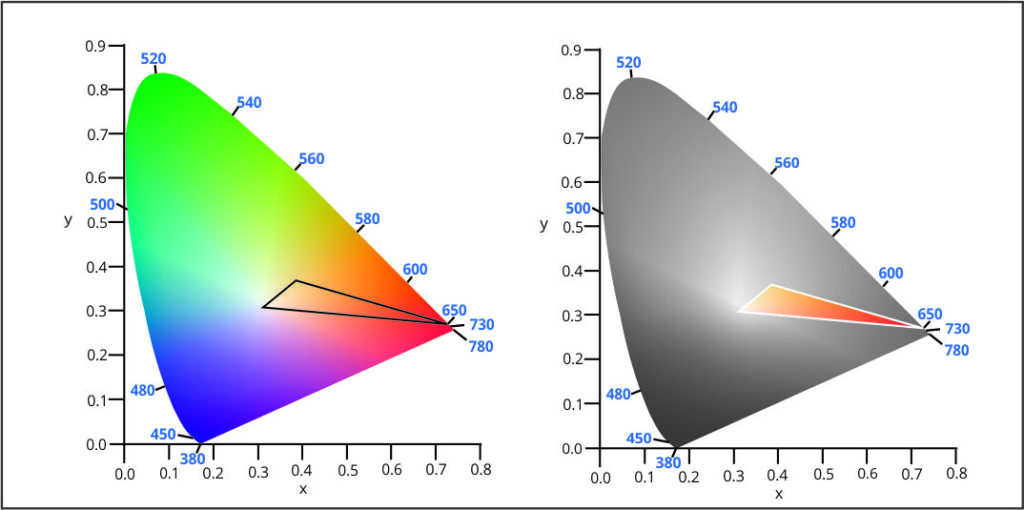
As the GROW3 products can adjust color spectrums, yielding endless color ratios, using the CIE 1931 chromaticity diagram format to express all the possible colors (the gamut) that the fixture can produce is the only method to describe the fixture’s true capabilities accurately.
Generally speaking, this is the full range of colors, gamut, that the fixture can produce, represented in the color space. This term in relation to grow lights means the color of light produced, not the color of light on a surface. Figure 2. demonstrates the fixtures’ color gamut on a CIE 1931 Chromaticity diagram.
Demonstrating the complete capability through use of the color gamut, the images in Figure 2 depict the color of the light from the fixture either on a full color CIE or grey color CIE chart, both of which highlight the capabilities of the light fixture.
Color gamut will become the best method to determine the actual color of light, rather than just spectrum graphs. These diagrams may also include the addition of the black body locus line, where the color white is defined.
For more information or to see how this new thinking could affect your applications, please get in touch with our team to see how the GROW3 can accomplish this.
Attention all horticulture enthusiasts and professional growers! Are you ready to take your grow lights to the next level? We are thrilled to announce an exclusive offer that you won't want…
Boosting Dairy Cow Health and Milk Production with Proper Lighting Proper lighting is essential for the health and productivity of dairy cows. Understading how lighting influences various aspects of cow welfare…
Lighting significantly influences livestock behavior and growth. Adopting LED lighting in animal farming is transformative, providing numerous benefits.